There are numerous freqtrade strategies available online if you search. Some of them would also put the results of the strategies’ backtests. Some of them might offer huge profits that might tempt you to start using them immediately. But please don’t. The issues with those articles and/or videos usually are
- They don’t do proper backtest
- They don’t check for any traps and biases
- They don’t dry running it themselves to see whether the strategy really works or not
- They don’t really use it themselves. All those thumbnails and click-bait titles are for the adsense, which is their actual source of income, not from using the strategy in live market.
Please carry out these steps if you have access to the strategy file.
- Analyze the code for backtest traps, lookahead bias and recursive issue
- If it passes all three checks above, backtest the code properly yourself using proper config and static list
- If your backtest result still shows good performance, then run it dry for several months
If you don’t have access to the strategy file or don’t want to follow the previous instructions but still want to know if the strategy is worthwhile, you can determine whether it’s worthwhile by looking at certain details in the backtest result. Let’s examine this backtest result.
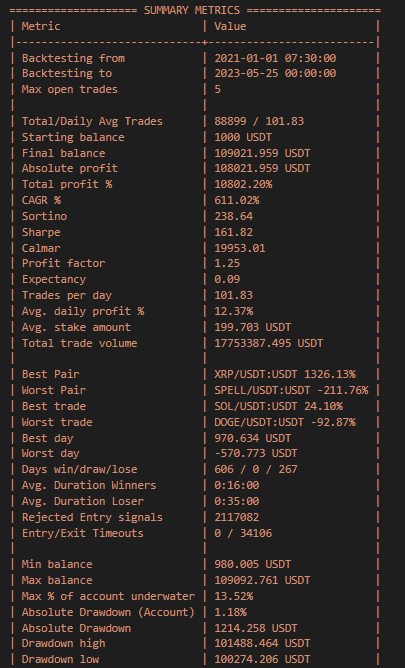
Trades per day
A daily average of 101.83 trades is shown in the result above. Assuming that this strategy is free of bias and traps, it will likely have very loose entry logic, which may be effective in a bull market but could wipe out your trading wallet in a bear market. My experience tells me that even an average of 10 trades a day is dangerous. I find that making an average of one trade every day suits my preferences. Low drawdown and fewer trades are my preferences. You can experiment with multiple strategies using various average trades to determine which ones are successful and suit your preferences. Some people can tolerate bigger drawdowns and prefer to make more trades.
Profit factor
Profit factor can be defined as the total profit divided by the total loss. In the example above, profit factor of 1.25 and nett profit of 108,021.959 USDT means the total profit is 540,109.795 USDT and total loss is 432,087.836 USDT. As you can see, the strategy no longer appears to be a brilliant one once you know the entire profit and loss.
Expectancy and Expectancy Ratio
Expectancy is estimated amount you expect to gain or loss per trade based of previous trades. So if your expectancy is 0.34 for example, it means everytime your bot open new trade, it’s expected to gain 0.34 USDT profit. Of course since this is an average, the actual profit/loss can vary, but it’s good to have a positive average.
Expectancy Ratio can be defined as the ratio of your average profit to your average loss. Because the strategy’s expectancy ratio in this example is 0.09, one losing trade will completely cancel out the gains from 11 winning ones.
Note: the backtest result above came from older freqtrade version, where it only calculates expectancy ratio. On latest freqtrade, it will show you both values.
Worst trade
The worst trade in the example was -92.87% on DOGE, which could be a liquidation exit. To have a losing trade reached liquidation, either
- It has a very bad entry logic that enter a trade near top of a downtrend, and/or
- It has a very bad risk management, which can be seen with no hard stoploss and no exit logics for downtrending trades
High rejected entry signals
Despite having relatively short average trade durations, there are a lot of rejected entry signals, which suggests that the entry logics are quite loose and that entry signals for numerous pairs would likely triggered simultaneously on the same candle.
Things not shown in the example result that would be helpful
Average profit %
This is an important number that most of the time can instantly show whether the strategy is really good or not. A lot of backtest results found online never show this number (intentionally or not). Let’s analyze this numbers for example (not related to the example above)
|       |   Entries |   Avg Profit % |   Cum Profit % |   Tot Profit USDT |   Tot Profit % |      Avg Duration |   Win  Draw  Loss  Win% |
| TOTAL |      2924 |           1.39 |        4051.44 |          1822.612 |           9.11 |    1 day, 7:31:00 |  2395     0   529  81.9 |
Based of past experiences, on average, maximum slippage that can occur in live trade is around 0.5%, which means in order to have a profitable dry/live run, it’s better to have backtest’s average profit % to be above 0,5%.
[…] I found a lambo strategy!!! […]